Transportation reports
The Reports page provides a complete business overview — for management, accounting, and strategic planning.
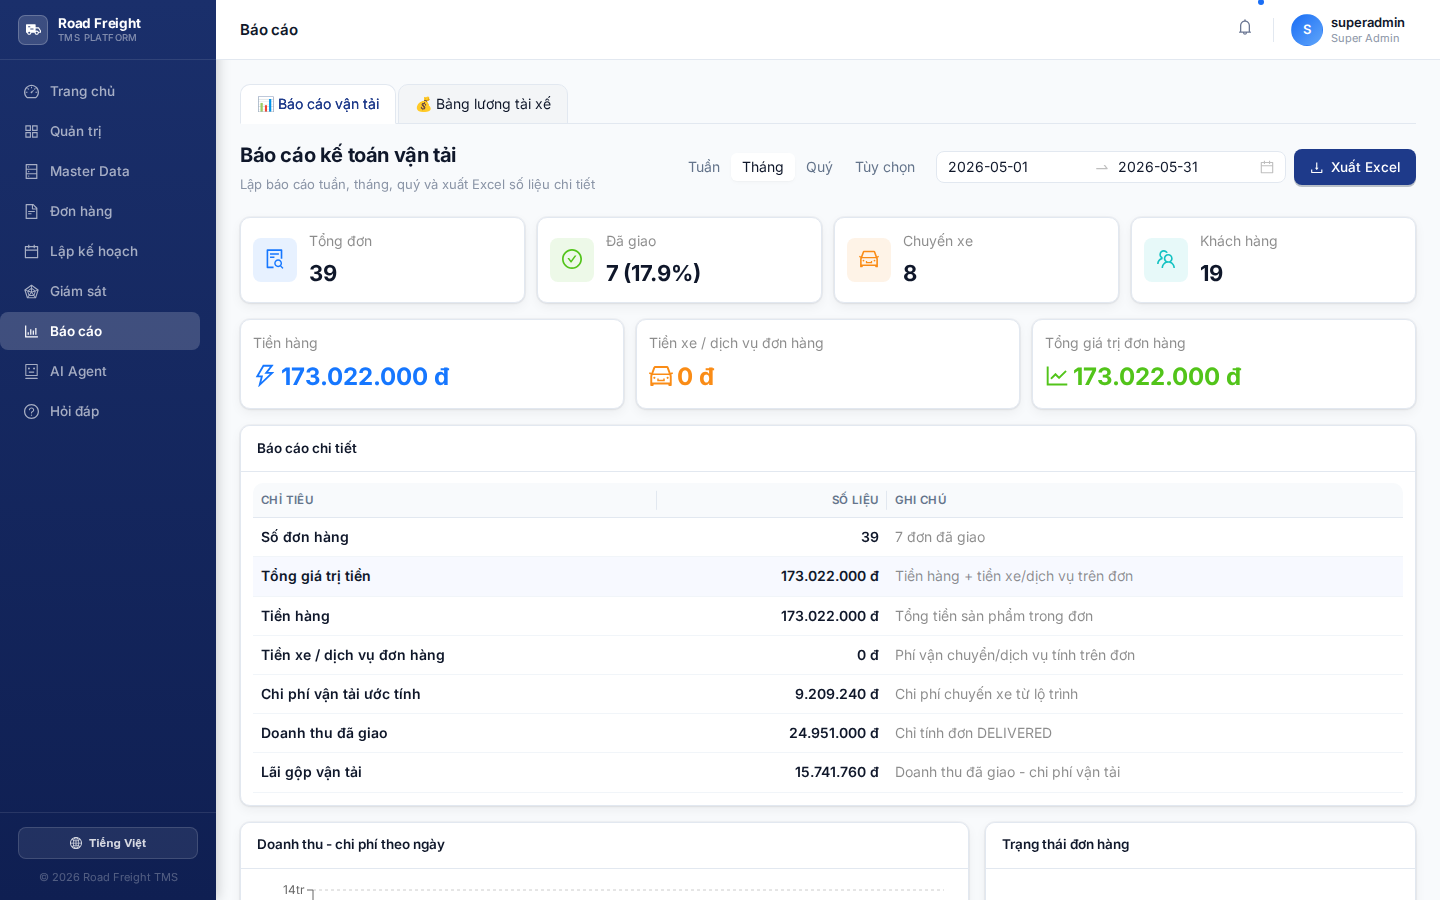
Choose reporting period
The top of the page has a period selector with 4 options:
| Period | Time range |
|---|---|
| Week | Monday → Sunday of current week |
| Month | Day 1 → last day of month |
| Quarter | Q1 / Q2 / Q3 / Q4 |
| Custom | RangePicker for any two dates |
Each change refreshes all KPIs + charts in 1-2 seconds.
The page polls the API every 30 seconds — numbers stay live without pressing F5.
4 main KPIs
The top row shows 4 KPI cards:
| Card | Meaning |
|---|---|
| 📄 Total orders | Number of orders in the period |
| ✅ Delivered (X%) | DELIVERED count + success rate |
| 🚛 Trips | Number of transport trips created |
| 👥 Customers | Distinct customers with orders in period |
3 money cards
Second row:
- 💰 Goods value — Total product value in orders (gross)
- 🚚 Service revenue — Shipping fee billed on orders
- 📊 Total order value — Goods value + service revenue
Detailed table
The "Detailed report" table lists 7 accounting metrics:
| Metric | Calculation |
|---|---|
| Order count | Total orders |
| Total order value | Sum(goodsAmount + serviceAmount) |
| Goods value | Sum(price × qty) over orders |
| Service revenue | Sum(servicePrice) over orders |
| Estimated transport cost | Sum(FixedCost + CostPerKm × km) from Trip |
| Delivered revenue | Counts only DELIVERED orders |
| Gross transport profit | Revenue - Cost |
- "Service revenue on order" = price charged to customer (revenue)
- "Transport cost" = actual cost to run vehicles (cost)
- Gross profit = difference — the key number for management
Visual charts
Daily revenue & cost
A bar chart with 3 series: Revenue (blue) · Cost (orange) · Gross profit (green) by day.
Order status (pie chart)
Share of:
- 🟦 Open (OPEN)
- 🟦 Picked & packed (PICKED_PACKED)
- 🟧 Shipped (SHIPPED)
- 🟩 Delivered (DELIVERED)
- ⬜ Cancelled
- 🟥 Rejected
Operational ratios
3 progress bars measuring efficiency:
- Approval rate = APPROVED / total orders
- Planning rate = orders with trip / total orders
- Delivery success = DELIVERED / total orders
Top customers
The "Top customers by revenue" table — top 8 customers including:
- Customer name + code
- Customer group
- Number of orders
- Revenue
Use it for 80/20 Pareto analysis — usually 20% of customers drive 80% of revenue.
Trip details
The last table lists every trip in the period: trip code, date, vehicle, driver, status, km, cost, COD collected.
Excel export
Click "Export Excel" at the top — downloads .xlsx with 5 sheets:
- Tong quan — KPIs + totals
- Don hang — per-order detail
- Chuyen xe — per-trip detail
- Khach hang — revenue by customer
- Theo ngay — daily figures
Standard format for accounting / audit submission.
AI Agent — Quick download
In the AI Agent, type:
- "Download this month's report" → opens Reports + period=month + auto-export
- "Weekly report" → period=week
- "Report from 1/5 to 17/5" → custom range
Saves clicks.
Next
- Driver payroll — Salary based on completed trips